NOAA's Center for Tsunami Research Case Study
After the disastrous Sumatra tsunami of 2004 there was a call to action by the U.S. Government to learn from that terrible event and Congress passed the Tsunami Warning and Education Act in 2006, which provided the funds to expand and upgrade the existing tsunami detection system. Congress also set tight time restrictions and mandated if a tsunami is detected a warning needs to be issued within 15 minutes.
Tsunami forecasting is something of a misnomer. It's not really possible to forecast or predict
a tsunami, but once seismic is activity is detected the goal is to create accurate wave impact
and inundation forecasts as quickly as possible.
NCTR's response was to create Tweb, a web-based tsunami modeling and forecasting application.
Tweb is a research application that predicts tsunami event magnitude, wave arrival and impact,
and is soon to be deployed for operational use.
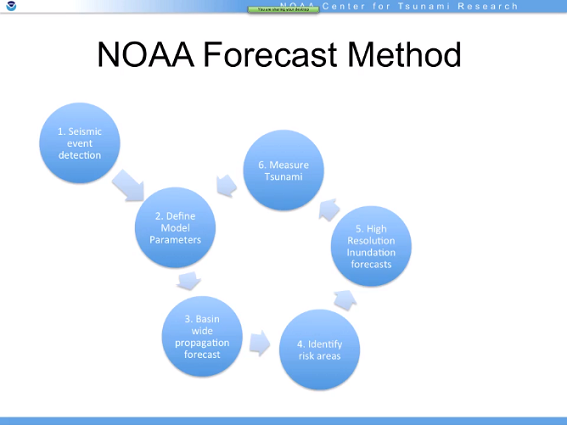
Detect a seismic event
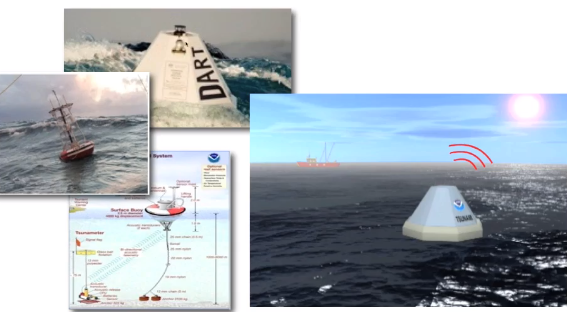
NOAA has 35 DART (Deep Ocean Assessment and Reporting Tsunamis) buoys all over the globe
measuring and transmitting the water level height in cm every few minutes. The next generation
buoys transmit every 15 seconds.
NCTR researchers receive earthquake data feeds from the U.S. Geological Survey and depending on the location of the seismic event, the magnitude of the earthquake and the DART data, the researchers are able to determine the feasibility of a tsunami
Defining the model parameters:
When a tsunami is detected, NCTR's effort is on to create a full model, with estimates of wave arrival time, wave height and coast line inundation in as few minutes as possible. The database has many pre-calculated, pre-loaded scenarios about tsunami propagation in a database. Initially the seismic data is the only information available. Tweb uses a model to simulate wave propagation, and inundation of dry land. There almost 2000 coastline models loaded into the database that map the geographic details of global shores around the world that map down to blocks of 50 x 100 sq m areas.
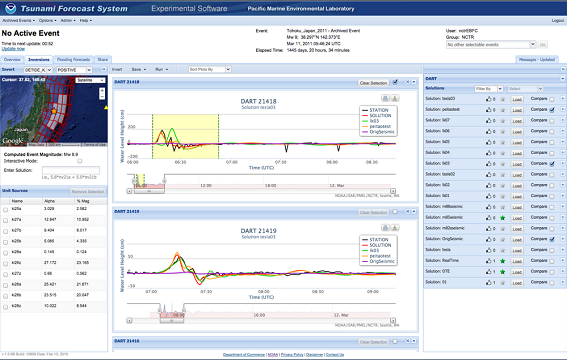
This is a reading from a DART buoy off the coast of Japan after the 2011 Tōhoku magnitude 9 earthquake. The normal variance of waves is around 3 – 4 cm and the first researchers reading these feeds thought the DART buoy was defective! But, the data was soon validated by other DART readings and Japanese seismic activity data as the reports started coming in from the Japan Meteorological Agency. The waves are measured and rendered into a model and GWT HighCharts is the backend component that generates the time series needed for the chart display of the DART buoys.
Creating the Forecast:
While a tsunami is tearing through the open waters and past other DART buoys the model is fed with updated readings. Forecasting is a reiterative process and the forecasters rerun the model until they have one that closely aligns to the actual reading. They zoom in on the time series data associated with the event, highlight a section of data and run an inversion analysis on the data to create an updated model. When they have a model that tracks very closely to the DART readings the forecaster has a high confidence in the model and this is the one they use to create a forecast.
Identifying high-risk areas
The first forecasts are rendered within about a minute and a half and include minimum and maximum wave amplitudes. The coastal areas are highlighted and forecasters can quickly see the coastline flooding and impact and have a very good idea of the wave arrival time. The forecasts are sent to a watch tender, these are people that man the systems 24 hrs/day to alert communities if there is a risk.
Building a high resolution inundation forecast and measuring the tsunami:
If the tsunami is big enough, NCTR runs high resolution flooding forecasts which have more accurate estimates of maximum wave height and coastal inundation, giving a very clear picture of how far inland the wave will travel. These forecasts are transmitted to emergency managers and used in operational warnings.
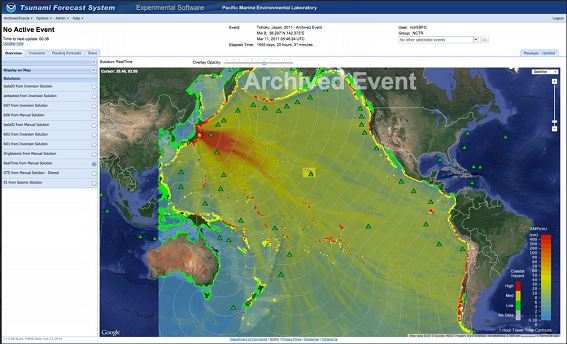
This is the propagation forecast from the 2011 Japanese tsunami, shortly after it passed over the second DART and the tidal gauge forecast for Honolulu.
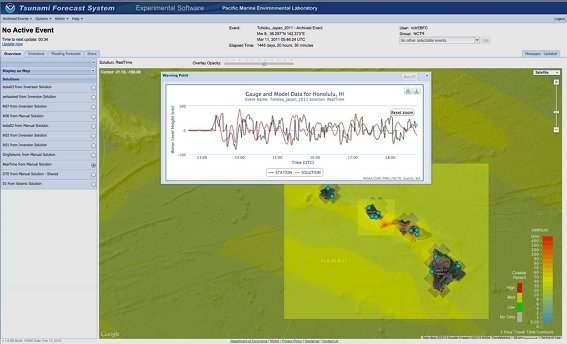
These forecasts are immediately used for decision making. After reviewing the above tidal gauge, the U.S. Navy needed to make a decision about moving their fleet in Pearl Harbor.
"The carrier fleet in Pearl Harbor after the 2011 Japanese tsunami decided not to evacuate due
to the tsunami forecasts, they evaluated the cost of the move wasn't necessary based on the
estimated of harbor flooding. This decision turned out to be the right one, the fleet was not
impacted and it saved the taxpayers a $1M cost of moving the fleet elsewhere."
- Eugene Burger
Congress has funded the operational deployment of Tweb and it will be going live soon. The first
deployment will start off the coast of Chile where there has been a lot of seismic
activity.
"GWT is instrumental for the Tweb application. The library from Moxie Group, which
provides a GWT interface to the HighCharts JavaScript library, was invaluable to the
success of the Tweb application. Producing interactive time series plots and the
functionality these plots are used for, is a key element to the tsunami modeling and
forecasting workflow. If we did not have the capability that the Moxie Group API
provided, we would not have been able to develop this application in the form it is."
Eugene Burger
Software Development Lead
NOAA Pacific Marine Environmental Laboratory